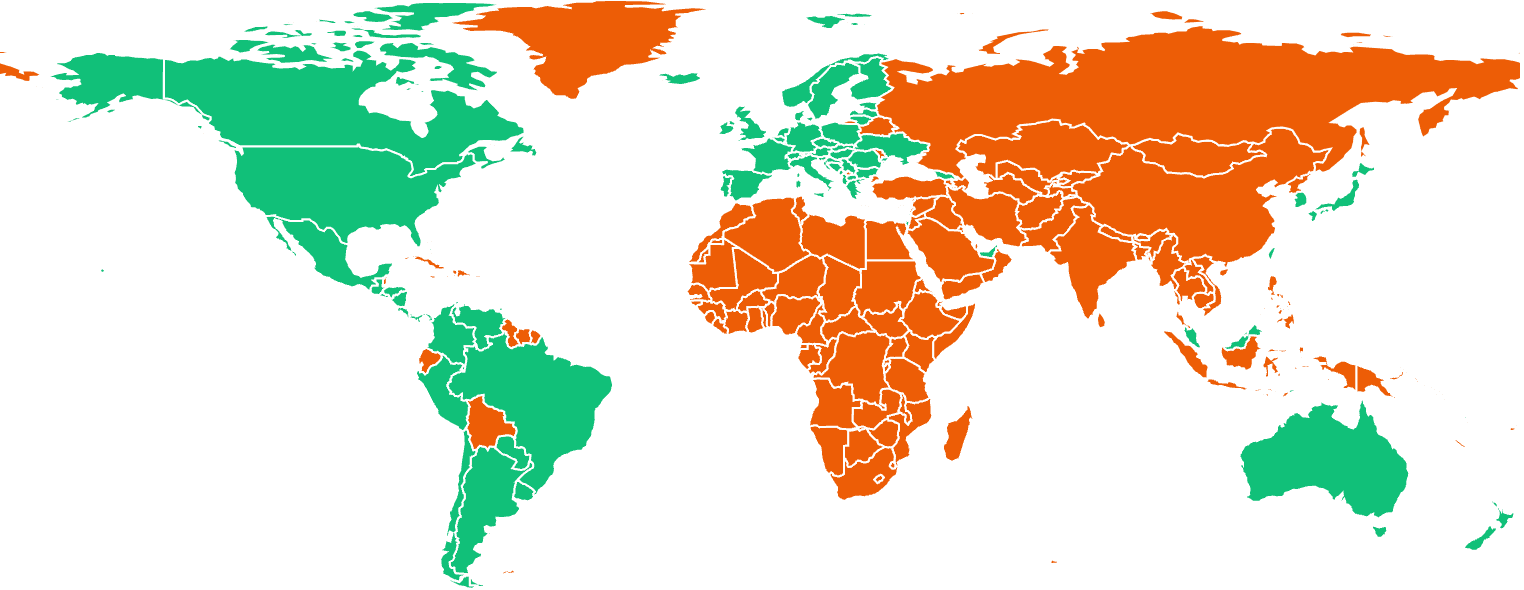
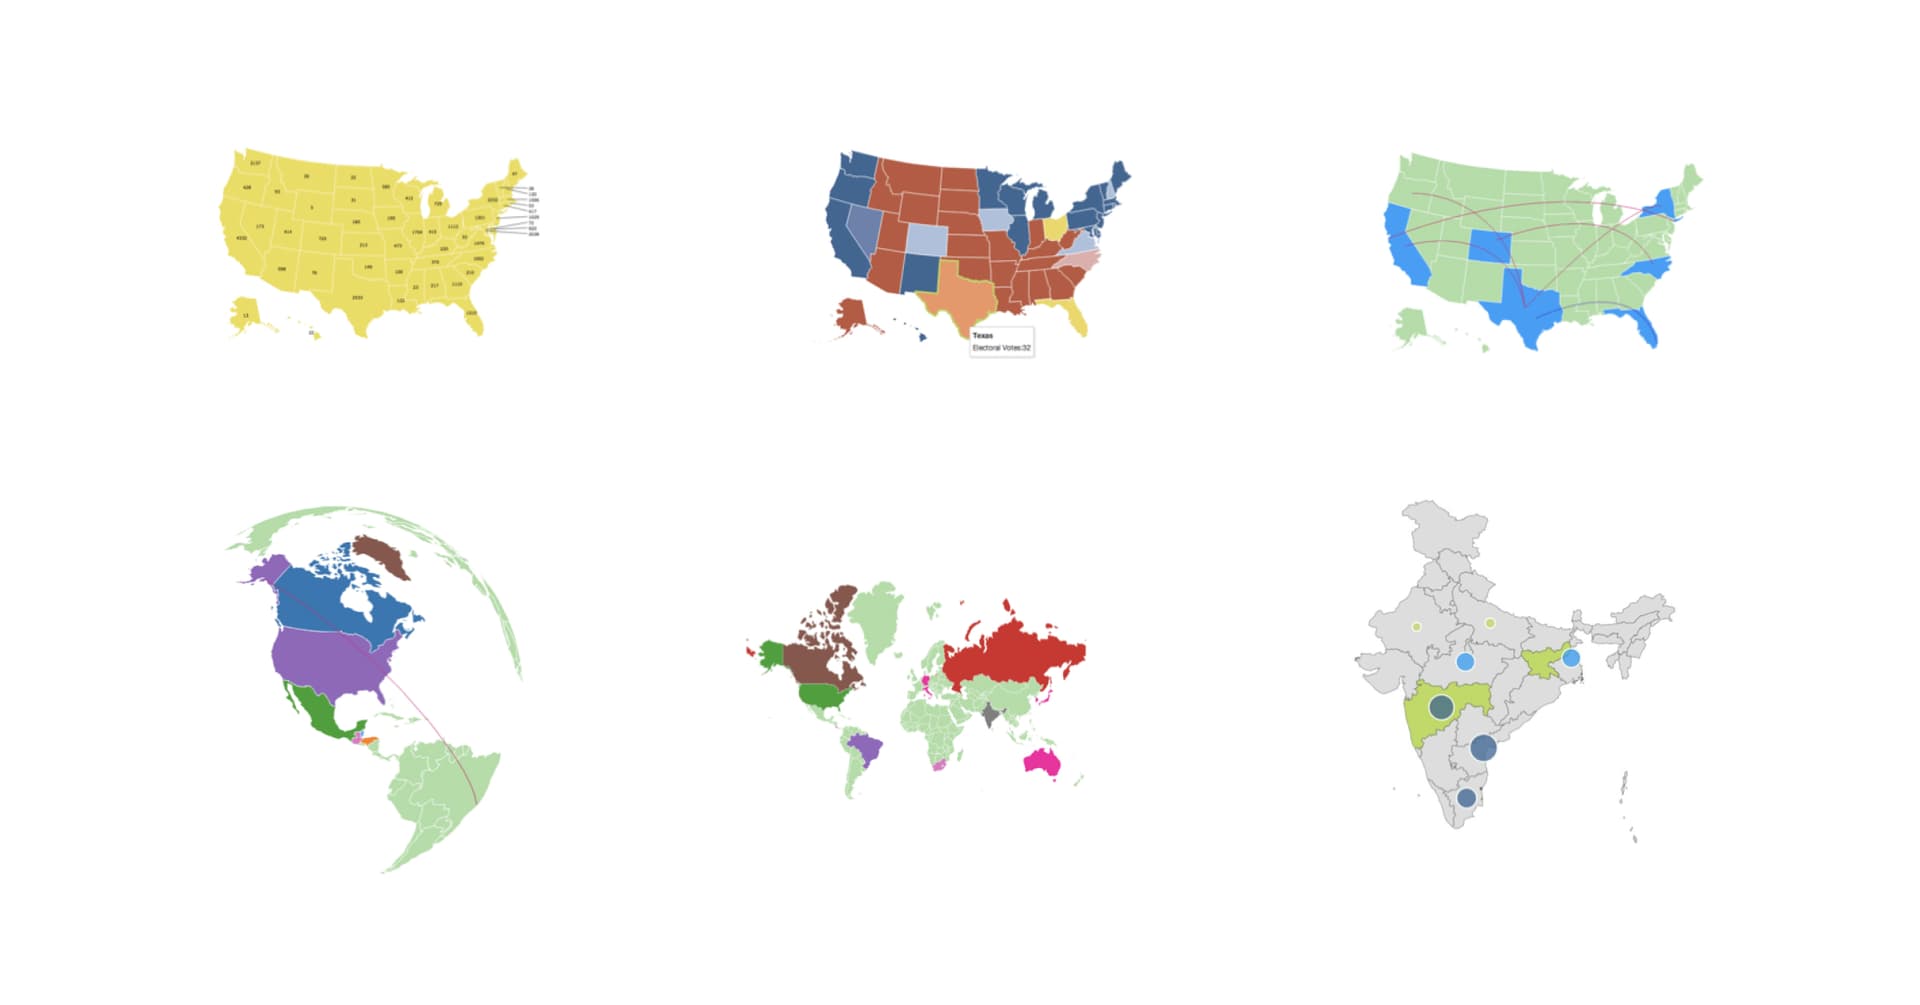
As a side project, I've created a website that should highlight specific countries and therfore needed a customized map.
I've achieved that using Datamaps by Mark DiMarco. It's easy and very customizable to show the world, a continent or a single country including labels connections and much more, so let's get started!
1. Include the necessary files
Include the libraries D3.js (for the visualization) and Topojson (for the geographical data) and of course the most important: Datamaps.js
You can easily include D3.js and Topojson through the CDN Cloudflare. Similar to Datamaps hosted on Github, however it is recommended to download it. Here you can get Datamaps.js and choose the right map for you in the dist folder. I want to create a world map so I took the datamaps.world.min.js file.
<script
  src="https://cdnjs.cloudflare.com/ajax/libs/d3/3.5.3/d3.min.js">
</script>

<script
  src="https://cdnjs.cloudflare.com/ajax/libs/topojson/1.6.9/topojson.min.js">
</script>

<script
  src="https://datamaps.github.io/scripts/0.5.0/datamaps.world.min.js">
</script>
2. Create the actual map
We create a container and set the position to relative to embed the map within.
<div id="map" style="position: relative;"></div> To include the Datamap itself we create a Datamap object as follows.
Note: I've added the responsive variable and set it to true since the default is false.
var map = new Datamap({
  element: document.getElementById('map'),
  responsive: true,
  // ...
  });
Responsive map
In order to have a responsive map, we shouldn't set the width and height of the container (however you could use relative values like 70%) and add an event listener that will be triggered when the window size changes.
window.addEventListener('resize', function() {
  map.resize();
});
3. Customize the map: Colorise countries
Now we want to customize our map further, in particular the colors of each country. First, we should be aware of how many groups we want to create meaning how many colors we want to use in the map. You then name each group with a variable (called fillKey) and set the color in hex code, RGB or RGBA.
In my case, I only used two groups so I have set the defaultFill Variable and created another variable called "visumfrei". This will be added within the datamaps object:
fills: {
  defaultFill: "#ef6802",
  visumfrei: "#10c784"
}
We now want to set the colors of each country by using the created color fill variables. Because I just added another color fill variable, I just had to set those countries. All the others will be set to the "defaulfFill" color. To set the color of each country we use the three digit country code and match it with the previously created fillKey, in my case "visumfrei". It will look like this:
data: {
  ALB: { fillKey: "visumfrei" },
  ARE: { fillKey: "visumfrei" },
  ARG: { fillKey: "visumfrei" },
}
Don't worry I got your back with the full list of all countries and their corresponding three digit country code:
Note: I came across the issue that three countries: "Kosovo, Northern Cyprus and Somaliland" can't be customized independently. Googling those countries I came up with the reason that those are not recognized as independent countries by many (well something new I learned on the go). To address those countries you can use the key "-99" instead of the normal country code key.
AFG,Afghanistan
AGO,Angola
ALB,Albania
ARE,United Arab Emirates
ARG,Argentina
ARM,Armenia
ATA,Antarctica
ATF,French Southern and Antarctic Lands
AUS,Australia
AUT,Austria
AZE,Azerbaijan
BDI,Burundi
BEL,Belgium
BEN,Benin
BFA,Burkina Faso
BGD,Bangladesh
BGR,Bulgaria
BHS,The Bahamas
BIH,Bosnia and Herzegovina
BLR,Belarus
BLZ,Belize
BOL,Bolivia
BRA,Brazil
BRN,Brunei
BTN,Bhutan
BWA,Botswana
CAF,Central African Republic
CAN,Canada
CHE,Switzerland
CHL,Chile
CHN,China
CIV,Ivory Coast
CMR,Cameroon
COD,Democratic Republic of the Congo
COG,Republic of the Congo
COL,Colombia
CRI,Costa Rica
CUB,Cuba
-99,Northern Cyprus
CYP,Cyprus
CZE,Czech Republic
DEU,Germany
DJI,Djibouti
DNK,Denmark
DOM,Dominican Republic
DZA,Algeria
ECU,Ecuador
EGY,Egypt
ERI,Eritrea
ESP,Spain
EST,Estonia
ETH,Ethiopia
FIN,Finland
FJI,Fiji
FLK,Falkland Islands
FRA,France
GUF,French Guiana
GAB,Gabon
GBR,United Kingdom
GEO,Georgia
GHA,Ghana
GIN,Guinea
GMB,Gambia
GNB,Guinea Bissau
GNQ,Equatorial Guinea
GRC,Greece
GRL,Greenland
GTM,Guatemala
GUY,Guyana
HND,Honduras
HRV,Croatia
HTI,Haiti
HUN,Hungary
IDN,Indonesia
IND,India
IRL,Ireland
IRN,Iran
IRQ,Iraq
ISL,Iceland
ISR,Israel
ITA,Italy
JAM,Jamaica
JOR,Jordan
JPN,Japan
KAZ,Kazakhstan
KEN,Kenya
KGZ,Kyrgyzstan
KHM,Cambodia
KOR,South Korea
-99,Kosovo
KWT,Kuwait
LAO,Laos
LBN,Lebanon
LBR,Liberia
LBY,Libya
LKA,Sri Lanka
LSO,Lesotho
LTU,Lithuania
LUX,Luxembourg
LVA,Latvia
MAR,Morocco
MDA,Moldova
MDG,Madagascar
MEX,Mexico
MKD,Macedonia
MLI,Mali
MMR,Myanmar
MNE,Montenegro
MNG,Mongolia
MOZ,Mozambique
MRT,Mauritania
MWI,Malawi
MYS,Malaysia
NAM,Namibia
NCL,New Caledonia
NER,Niger
NGA,Nigeria
NIC,Nicaragua
NLD,Netherlands
NOR,Norway
NPL,Nepal
NZL,New Zealand
OMN,Oman
PAK,Pakistan
PAN,Panama
PER,Peru
PHL,Philippines
PNG,Papua New Guinea
POL,Poland
PRI,Puerto Rico
PRK,North Korea
PRT,Portugal
PRY,Paraguay
QAT,Qatar
ROU,Romania
RUS,Russia
RWA,Rwanda
ESH,Western Sahara
SAU,Saudi Arabia
SDN,Sudan
SSD,South Sudan
SEN,Senegal
SLB,Solomon Islands
SLE,Sierra Leone
SLV,El Salvador
-99,Somaliland
SOM,Somalia
SRB,Republic of Serbia
SUR,Suriname
SVK,Slovakia
SVN,Slovenia
SWE,Sweden
SWZ,Swaziland
SYR,Syria
TCD,Chad
TGO,Togo
THA,Thailand
TJK,Tajikistan
TKM,Turkmenistan
TLS,East Timor
TTO,Trinidad and Tobago
TUN,Tunisia
TUR,Turkey
TWN,Taiwan
TZA,United Republic of Tanzania
UGA,Uganda
UKR,Ukraine
URY,Uruguay
USA,United States of America
UZB,Uzbekistan
VEN,Venezuela
VNM,Vietnam
VUT,Vanuatu
PSE,West Bank
YEM,Yemen
ZAF,South Africa
ZMB,Zambia
ZWE,Zimbabwe
There are more customization options, connections, bubbles labels… You'll find all customization options of Datamaps here.
Result
Done, now you see the final map as we customized it!

This is the full code example used to create the map above:
<script
  src="https://cdnjs.cloudflare.com/ajax/libs/d3/3.5.3/d3.min.js">
</script>

<script
  src="https://cdnjs.cloudflare.com/ajax/libs/topojson/1.6.9/topojson.min.js">
</script>

<script
  src="https://datamaps.github.io/scripts/0.5.0/datamaps.world.min.js">
</script>

<div id="map" style="position: relative;"></div>

<script>
var map = new Datamap({
    element: document.getElementById("map"),
    responsive: true,
    fills: {
    defaultFill: "#ef6802",
    visumfrei: "#10c784"
    },
    data: {
    ALB: { fillKey: "visumfrei" },
    ARE: { fillKey: "visumfrei" },
    ARG: { fillKey: "visumfrei" },
    AUS: { fillKey: "visumfrei" },
    AUT: { fillKey: "visumfrei" },
    BEL: { fillKey: "visumfrei" },
    BGR: { fillKey: "visumfrei" },
    BHS: { fillKey: "visumfrei" },
    BIH: { fillKey: "visumfrei" },
    BRA: { fillKey: "visumfrei" },
    BRN: { fillKey: "visumfrei" },
    CAN: { fillKey: "visumfrei" },
    CHE: { fillKey: "visumfrei" },
    CHL: { fillKey: "visumfrei" },
    COL: { fillKey: "visumfrei" },
    CRI: { fillKey: "visumfrei" },
    CYP: { fillKey: "visumfrei" },
    CZE: { fillKey: "visumfrei" },
    DNK: { fillKey: "visumfrei" },
    ESP: { fillKey: "visumfrei" },
    EST: { fillKey: "visumfrei" },
    FIN: { fillKey: "visumfrei" },
    FRA: { fillKey: "visumfrei" },
    GBR: { fillKey: "visumfrei" },
    GEO: { fillKey: "visumfrei" },
    GRC: { fillKey: "visumfrei" },
    GTM: { fillKey: "visumfrei" },
    HND: { fillKey: "visumfrei" },
    HRV: { fillKey: "visumfrei" },
    HUN: { fillKey: "visumfrei" },
    IRL: { fillKey: "visumfrei" },
    ISL: { fillKey: "visumfrei" },
    ISR: { fillKey: "visumfrei" },
    ITA: { fillKey: "visumfrei" },
    JPN: { fillKey: "visumfrei" },
    KOR: { fillKey: "visumfrei" },
    LTU: { fillKey: "visumfrei" },
    LUX: { fillKey: "visumfrei" },
    LVA: { fillKey: "visumfrei" },
    MEX: { fillKey: "visumfrei" },
    MKD: { fillKey: "visumfrei" },
    MNE: { fillKey: "visumfrei" },
    MYS: { fillKey: "visumfrei" },
    NIC: { fillKey: "visumfrei" },
    NLD: { fillKey: "visumfrei" },
    NOR: { fillKey: "visumfrei" },
    NZL: { fillKey: "visumfrei" },
    PAN: { fillKey: "visumfrei" },
    PER: { fillKey: "visumfrei" },
    POL: { fillKey: "visumfrei" },
    PRT: { fillKey: "visumfrei" },
    PRY: { fillKey: "visumfrei" },
    ROU: { fillKey: "visumfrei" },
    SLB: { fillKey: "visumfrei" },
    SLV: { fillKey: "visumfrei" },
    SRB: { fillKey: "visumfrei" },
    SVK: { fillKey: "visumfrei" },
    SVN: { fillKey: "visumfrei" },
    SWE: { fillKey: "visumfrei" },
    TLS: { fillKey: "visumfrei" },
    TTO: { fillKey: "visumfrei" },
    TWN: { fillKey: "visumfrei" },
    UKR: { fillKey: "visumfrei" },
    URY: { fillKey: "visumfrei" },
    USA: { fillKey: "visumfrei" },
    VEN: { fillKey: "visumfrei" },
    VUT: { fillKey: "visumfrei" },
    DEU: { fillKey: "visumfrei" }
    // "-99": { fillKey: "marked" }
    }
});

//responsive map
window.addEventListener("resize", function() {
    map.resize();
});
</script>