
If you're a marketer and responsible for different channels of your company like Google, Facebook, LinkedIn, it's hard to combine them, if you don't already have a data management tool in place. The good news is that Google Data Studio can be used with a little workaround for exactly that purpose. So if you like to create a dashboard with calculated numbers of various marketing channels, this post is for you.
Setup
You should already have installed the corresponding connectors to use the data sources of your choice. In my case that was the Supermetrics Connector for Facebook Ads. You can use a trial and after it expires you will be still available to access the Facebook data, but only for a period of 10 days.
1. Add Table
First of all, you should add a table to your data studio page. You will be able to change it to a scorecard or any other chart-type later on.
2. Blend Data
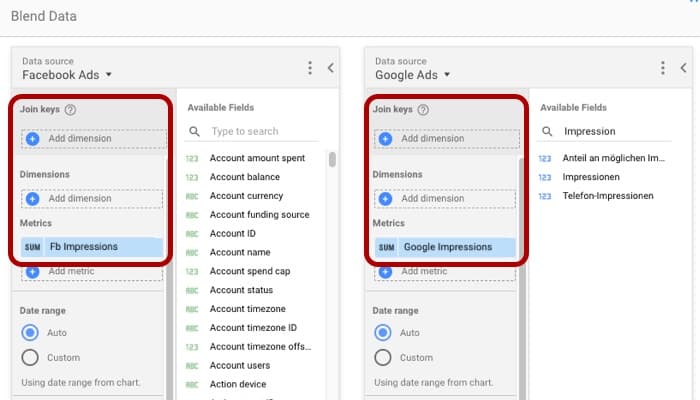
Select the table and choose "blend data" as a data source in the right column. Chose the metrics from each data source which you like to include in your calculation. I have selected impressions on Facebook and Google to come up for a metric for the brand campaign.
You can rename the metrics of each data source to make it clear later on. Don't choose a join key and dimension (even though it is recommended), it will work without. Save the blended data at the end.
3. Add Calculated Field
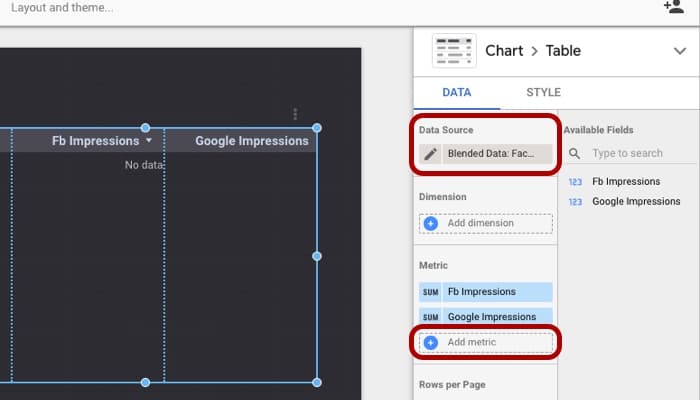
Back in the table menu make sure that you have the blended data as the data source and no dimension is selected. Go over to the metric area and select add metric and then "create field" at the bottom.
4. Insert Formula
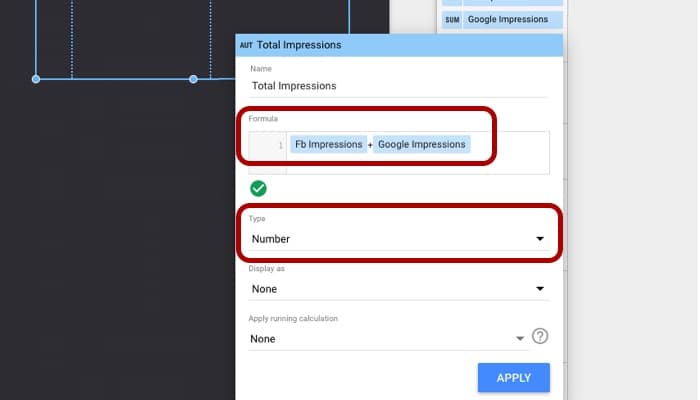
Name the new field as you like and add the formula e.g. for the sum simply type the name of the metrics and add a plus sign. Make sure the data type is the right one.
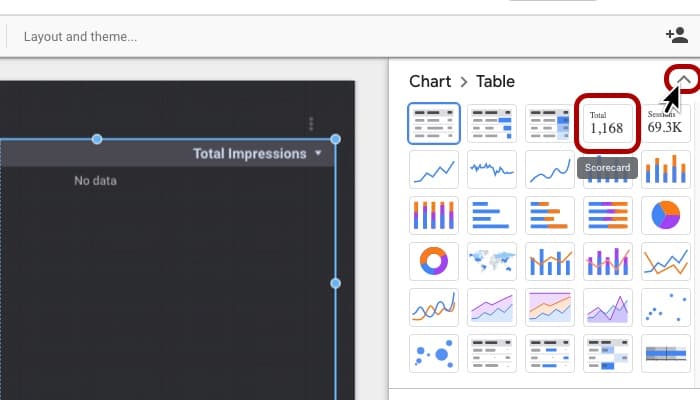
5. Delete Metrics and Change Chart Type
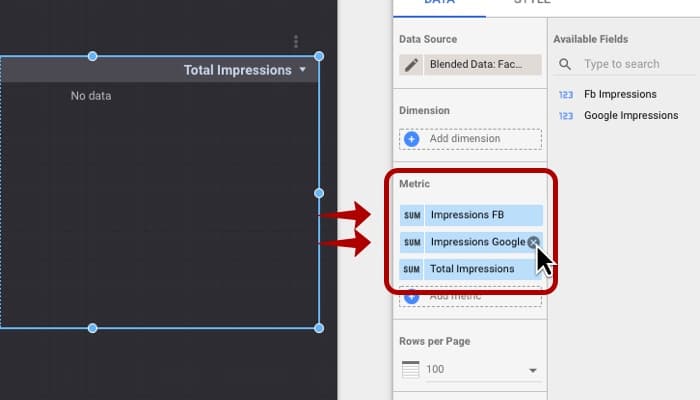
Just keep the calculated field and delete all the other metrics that you have used in the calculation if you haven't deleted them already. Now you can change the chart type from table to scorecard or any other chart that fits.
Done! Now you have a metric you can easily report or do a benchmarking with.