Until recently, I used to create state diagrams and visuals of some processes with Sketch. Simply to have a better overview and understanding of some processes and how I can optimize them.
However, I found out about Mermaid: A JavaScript package, which makes it very easy to create diagrams and charts through writing Markdown. It is almost as intuitive as writing it down on paper and surely easier to update and include in your version control.
Benefits are:
- Easy to learn
- Version control with GitHub
- No separate diagram tool needed
- Open-source
- Good support
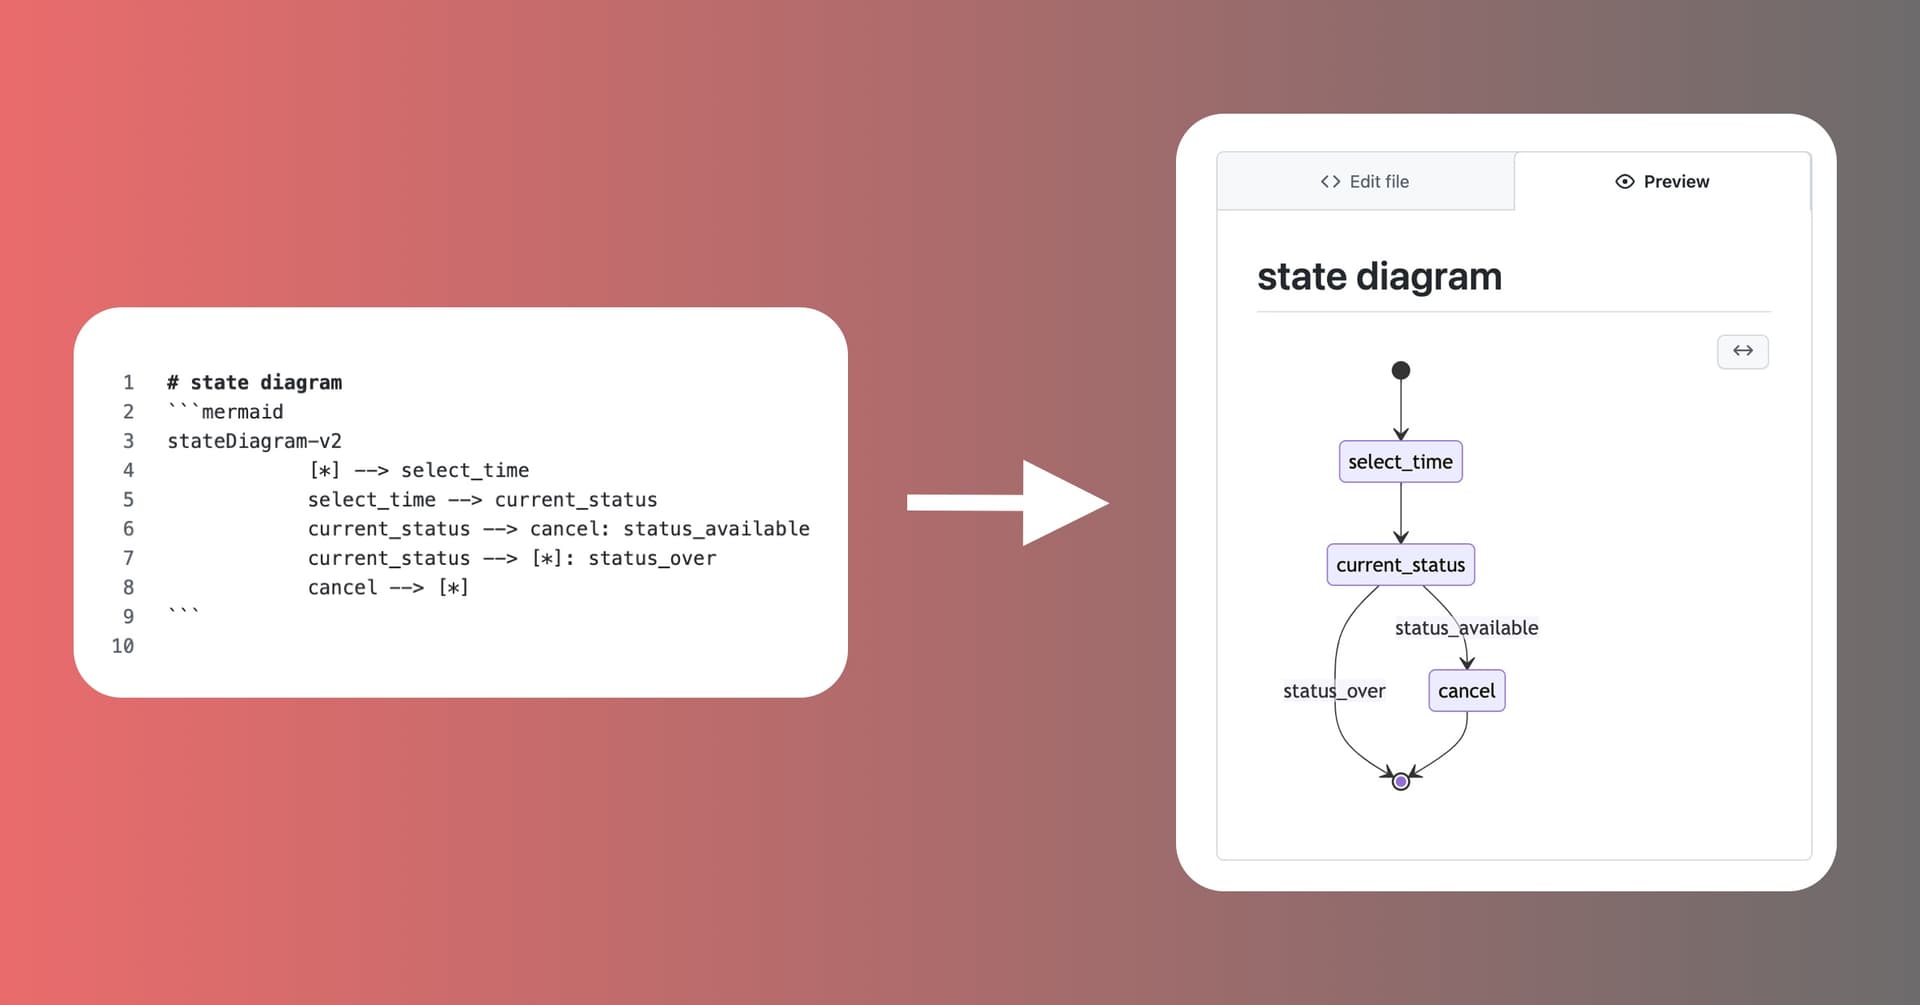
A simple diagram example with Mermaid
When you look at this code snippet it's almost self-explaining. The Markdown file has a Mermaid code block which includes states, transitions, start and endpoint. The arrows simply show the relation between the states.
This examples demonstrates how easy it is be to create a Mermaid diagram.
stateDiagram-v2
    [*] --> select_date
    select_date --> select_time
    select_time --> current_status
    current_status --> cancel: status_available
    current_status --> [*]: status_over
    cancel --> [*]
This renders into the shown diagram:
Supported in Github, VS Code, and JetBrains IDEs
GitHub
Github renders every Mermaid code-block inside of Markdown files, issues, and PR comments automatically into an iframe, which works fantastic plus you have version control. You can find the official announcement on Github here.
VS-Code
If you are using VS Code like me, I recommend installing the Mermaid Markdown plugin. That way Mermaid code-blocks will be rendered in the preview window.
JetBrains
Also, JetBrains' IDEs support Mermaid. You can enable it by going to Settings/Preferences → Languages & Frameworks → Markdown in the Markdown Extensions section.
I am a big fan of the VS Code plugin to create diagrams/charts and instantly see how the diagram turns out. However, if you are in need of a more extensive tool, Mermaid also offers a Live Editor.
Embed Mermaid Diagrams on your website
- Reference the Mermaid CDN with the
scripttag
<script src="https://cdn.jsdelivr.net/npm/mermaid/dist/mermaid.min.js">
</script>- Make a call with
mermaid.initialize()to select all Mermaid diagrams and render them
<script> mermaid.initialize({ startOnLoad: true });</script>- The Mermaid diagram should be placed within a div and the class name of that div must be
mermaid
<div class="mermaid">
stateDiagram-v2
    [*] --> select_time
    select_time --> current_status
    current_status --> cancel: status_available
    current_status --> [*]: status_over
    cancel --> [*]
</div>
The full code example is as follows:
<body>
    <div class="mermaid">
        stateDiagram-v2
            [*] --> select_time
            select_time --> current_status
            current_status --> cancel: status_available
            current_status --> [*]: status_over
            cancel --> [*]
    </div>

    <script src="https://cdn.jsdelivr.net/npm/mermaid/dist/mermaid.min.js">
    </script>
    <script>
        mermaid.initialize({ startOnLoad: true });
    </script>
</body>
Embed Mermaid in WordPress
You can embed your Mermaid diagrams/charts also in WordPress, but you have to be careful with the formatting. WordPress doesn't preserve whitespace so Mermaid won't render correctly. A quick fix is using a plugin like Simple Embed Code to include your code. You have to create a custom field with the Mermaid div and include that field in your post/page.
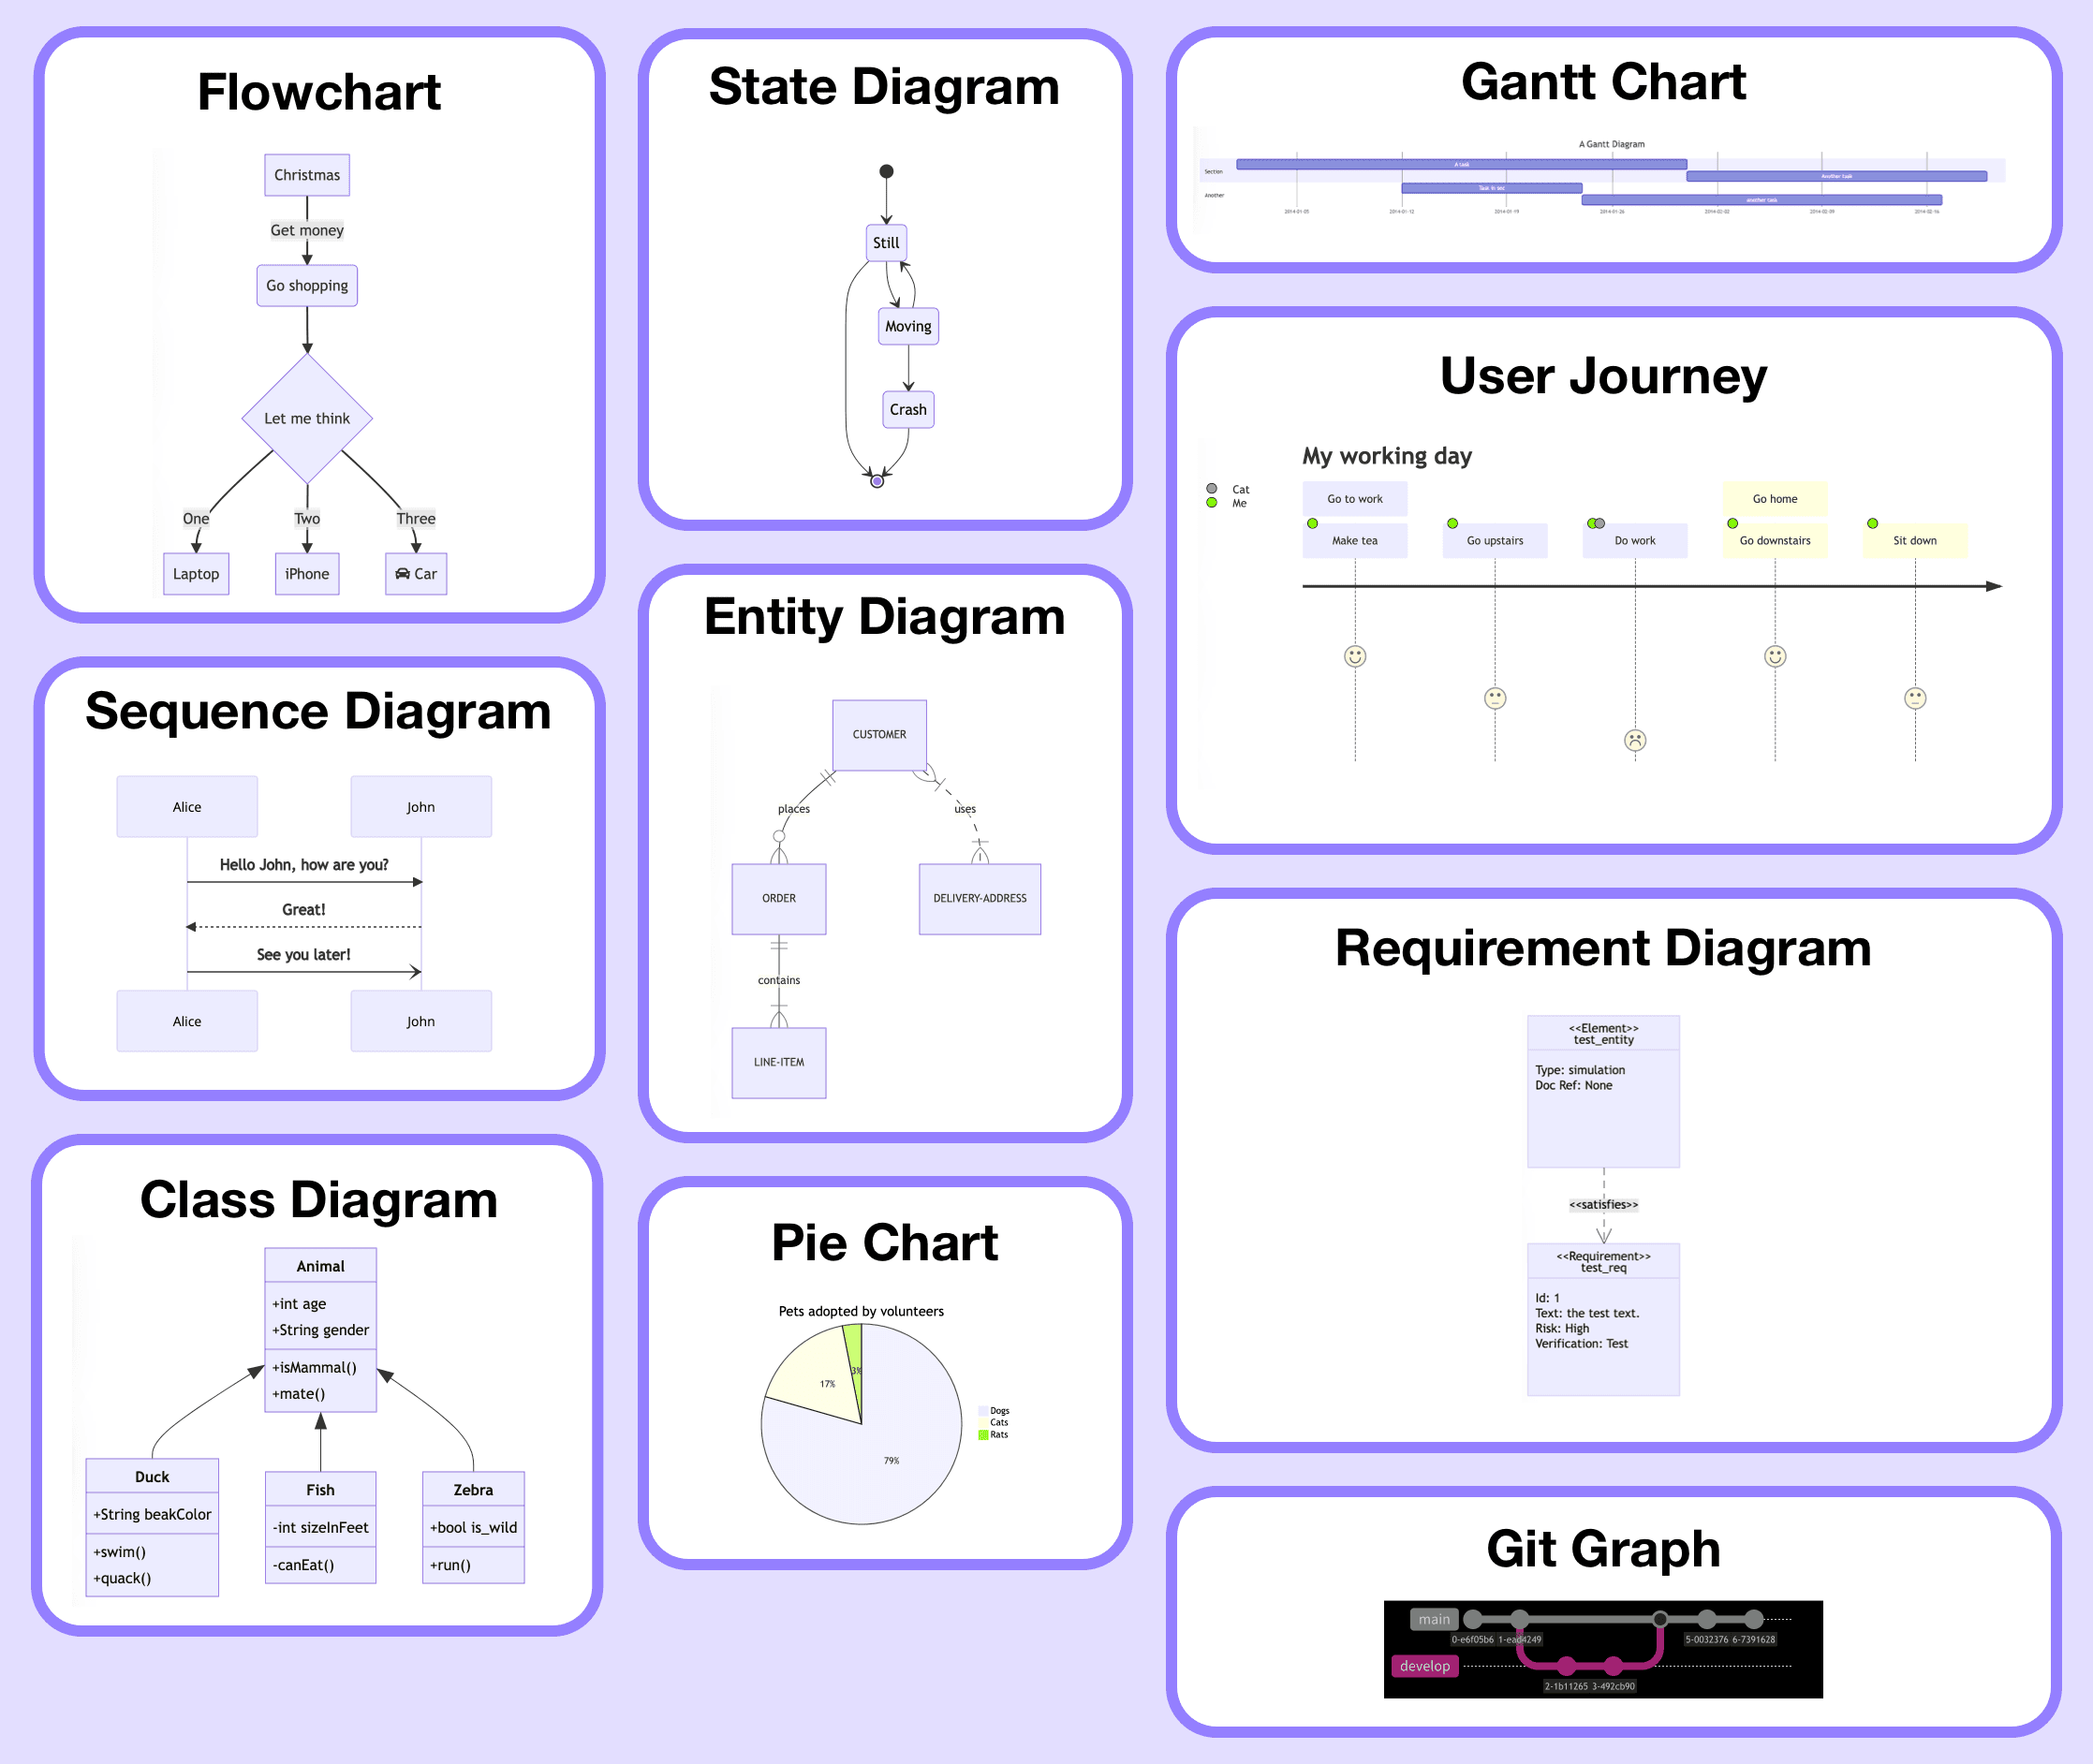
Different kinds of Mermaid diagrams
Here is a overview of different diagrams and charts that are possible to create with Mermaid:
Flowchart
Probably the most used diagram with Mermaid is the flowchart. There you have two kinds of elements to model the process nodes and links/edges:
Nodes
Different geometric shapes
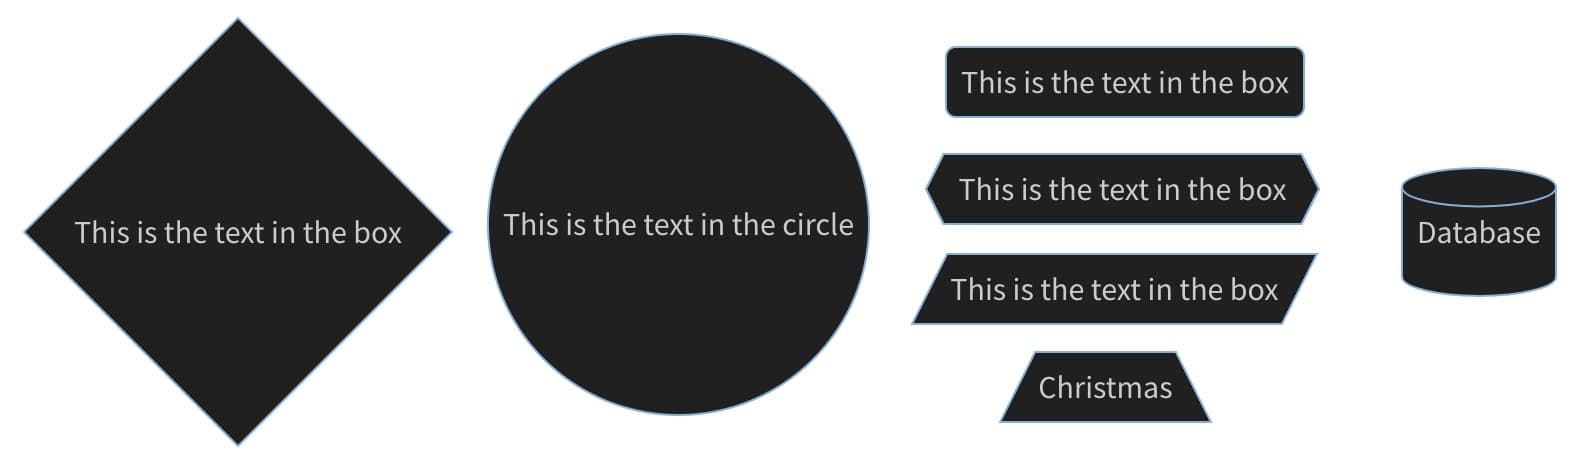
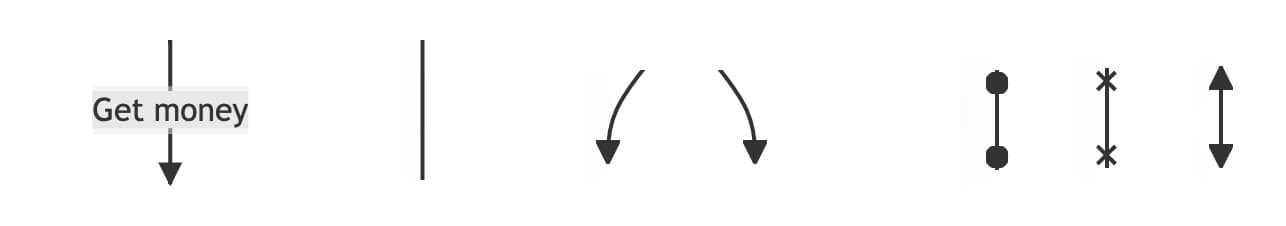
Links/Edges
The connections between the nodes, with or without label
More Diagrams and Charts
Here you can see an overview and pick the right diagram which fits your needs
Here is the Mermaid documentation to dive into.
Happy coding! ✌️