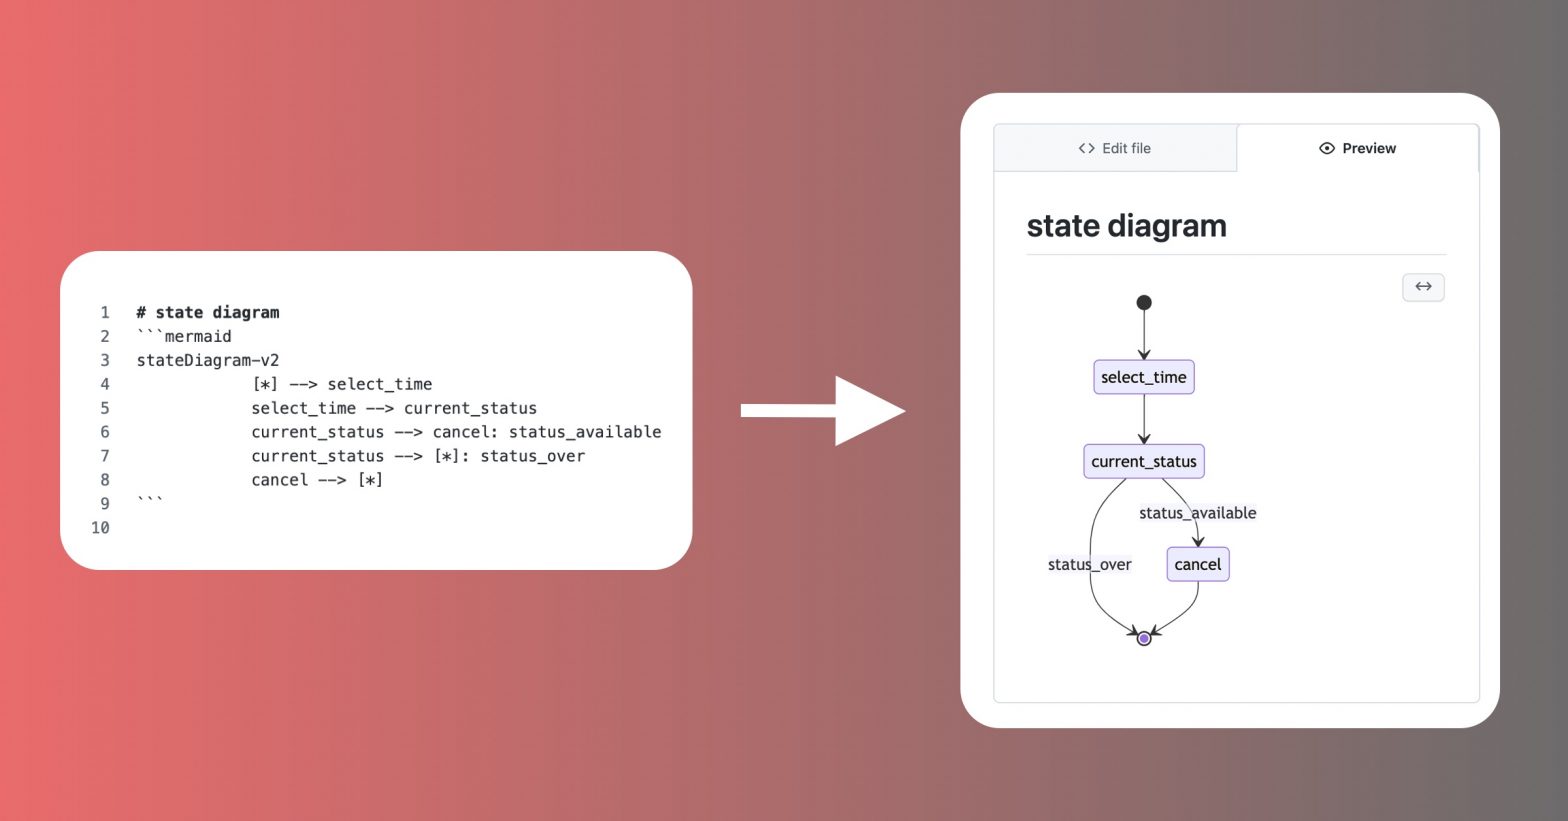
With Mermaid, you can embed diagrams directly into your Github repository without installing anything. Until recently, I used to create state diagrams and visuals of some processes with Sketch. Simply to have a better overview and understanding of some processes and how I can optimize them. However, I found out about Mermaid: A JavaScript package,… Continue reading Mermaid: How to create diagrams and charts in Markdown
Tag: Charts
Datamaps: How to create and customize a map with JavaScript
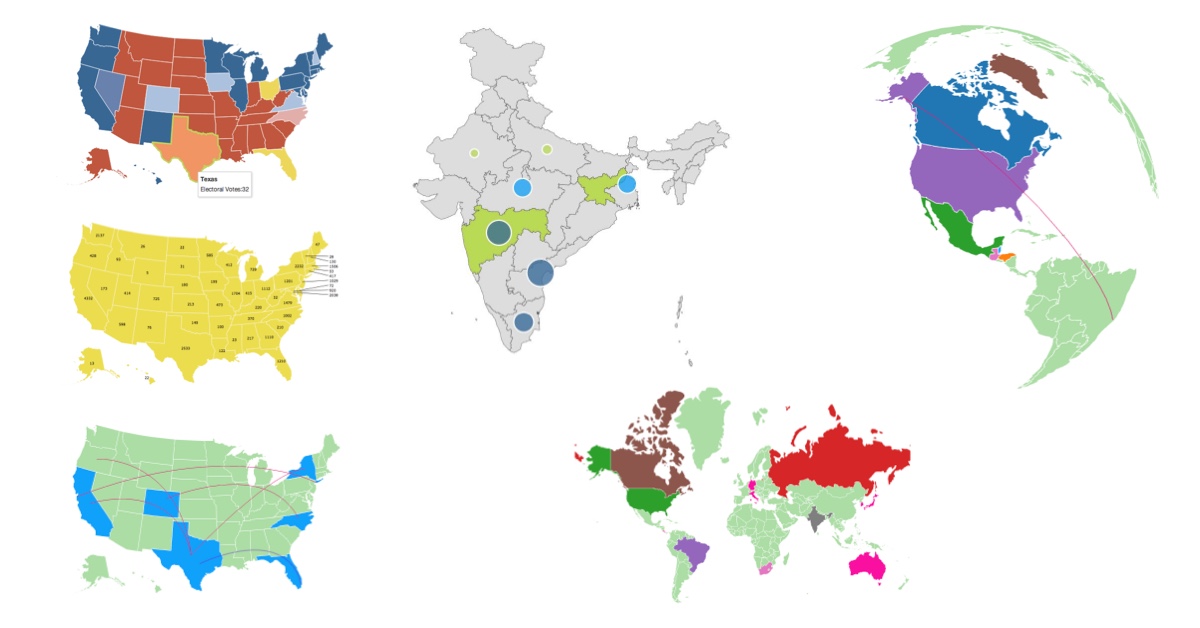
In 3 simple steps, you will learn how to create a map and customize it to your needs As a side project, I’m currently creating a website that should provide quick tutorials on how German citizens can get their travel visa and which options there are (visumsuche.de). For this project I needed a custom map… Continue reading Datamaps: How to create and customize a map with JavaScript

